Wooly Worms Lab
Conclusion:
a. The degrees of freedom used in this exercise was six.
b. omit
c. The calculated chi-square value is 40.06.
d. The results indicate that the results were not caused by chance, and that the results occurred from a significant nonrandom event. This is evident by the high chi-square value calculated from the exercise.
e. The green wooly worms had a positive selection pressure because their color helped them blend in with the grass. The multicolored worms and bright red worms had a negative selection pressure because their bright color made them stand out from their surroundings and be easy prey for predators. The larger worms also had a negative selection pressure as their large size made them noticeable to predators.
f. These results indicate that the Shrek and Burt wooly worms are likely to die off due to their size, and that the blue and red worms are likely to die off as well due to natural selection.
g. If a bird does not have very sharp senses it will be more difficult for them to see the green wooly worms that blend in with their surroundings. This makes the bright colored worms subject to being preyed on more. Feeding times of birds may dictate which birds get consumed. For example if a bird feeds at night they will not be able to see the darker colored worms as much as the brightly colored worms. If a bird has a sharp eye they will be able to see the worms that blend in with their surroundings. This bird will have an advantage as it will have a larger supply of food by being able to prey on the less visible worms.
h. If the environment remained unchanged then the green colored worms will have an advantage. The population will shift from being multicolored to mainly being green. In ten years the community will be mainly string bean and olive garden wooly worms.
Parking Lot Species Diversity
Post-lab Questions:
1. Identify the parking lot that was the most diverse. Based on your observations during the lab, explain why your prediction in question #1 of the prelab was supported or not supported.
- The student parking lot was the most diverse with a Shannon Diversity Index of 2.375, compared to the staff parking lot's diversity index of 2.372.
2. List the single most abundant species in each set of data, and write a plausible explanation to explain why these are the most abundant species.
-For the student parking lot the single most abundant species were Chevy vehicles with a total of 23. This may be because men are more likely to drive trucks, which Chevy makes, and some people may prefer Chevy vehicles as Chevy is an American company.
-For the staff parking lot the single most abundant species were Ford vehicles with a total of 14. The reason for this may be because some people prefer Fords as Ford is an American company. Ford also makes a variety of cars, ranging from trucks to small cars.
3. Determine the maximum and minimum values for the Shannon Diversity Index in the parking lot you surveyed.
-The student parking lot had the maximum value for the Shannon Diversity Index with a value of 2.375. The staff parking lot had the minimum value for the Shannon Diversity Index with a value of 2.372.
4. If you conducted this lab in a shopping mall parking lot, predict whether the Shannon Diversity Index would be high or low, and how it would compare to the school parking lots.
- If this lab was performed in a shopping mall parking lot the Shannon Diversity Index would be higher, due to the larger population. Unlike the student and staff parking lots there are more cars at a shopping mall allowing for more diversity. There is also a greater variety of people, with differing characteristics that may influence their choice of car.
5. If you conducted this lab at a new car dealership, predict whether the Shannon Diversity Index would be high or low, and how it would compare to the school parking lots.
-If this lab was performed at a new car dealership the Shannon Diversity Index would be lower. Unlike the student and staff parking lots there would only be one type of species (car brand) present at the dealership.
Feedback Loops
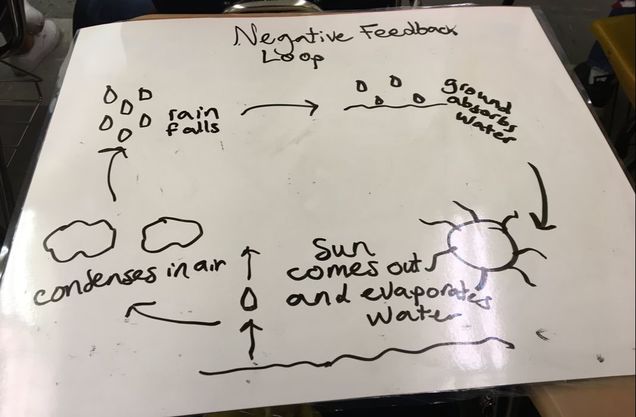
-A negative feedback loop for rainfall.
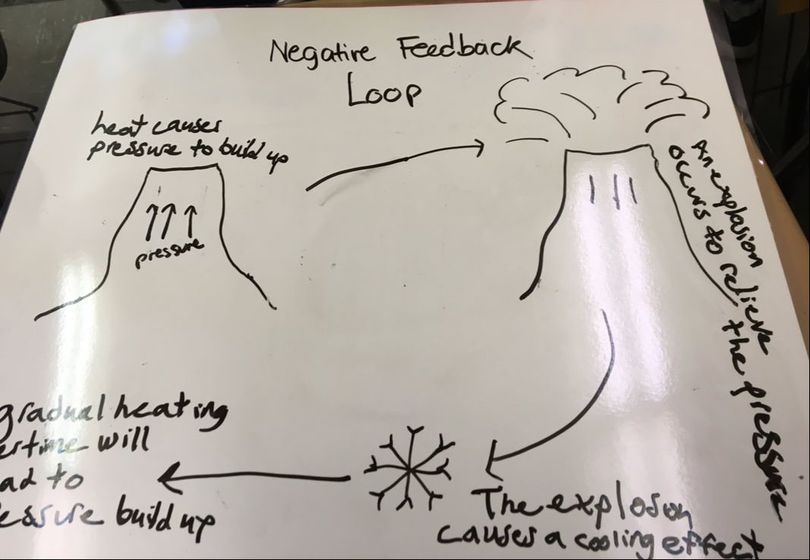
-A negative feedback loop for volcanic eruptions.
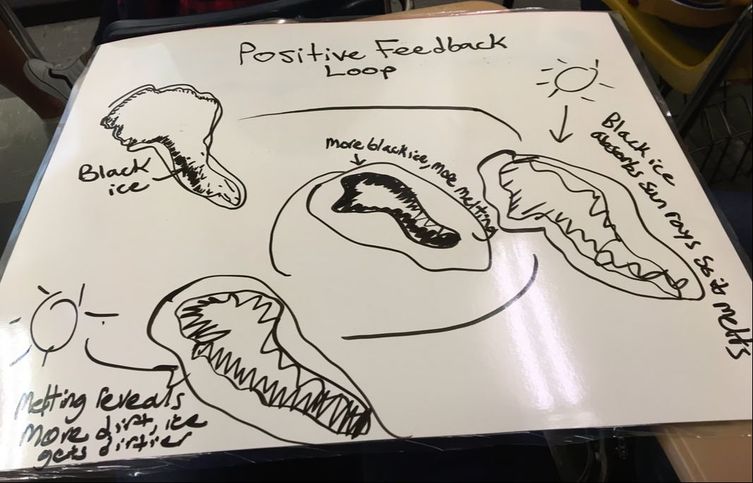
-A positive feedback loop for glaciers melting.
Climate Data Snapshots
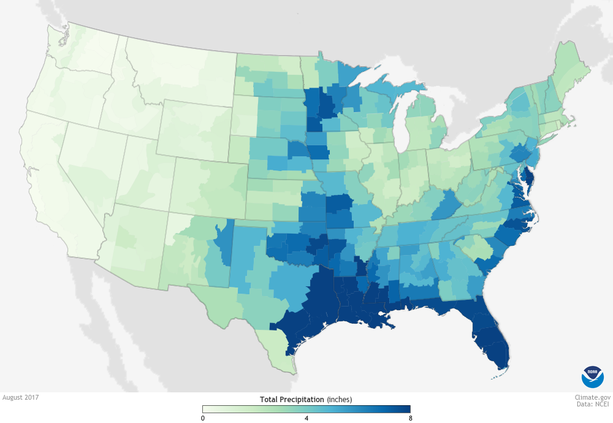
Total precipitation for the month of August, 2017
-The southeastern most part of the country seems to receive the most rain during August. This makes sense especially with hurricane season hitting these two areas .
-The southeastern most part of the country seems to receive the most rain during August. This makes sense especially with hurricane season hitting these two areas .
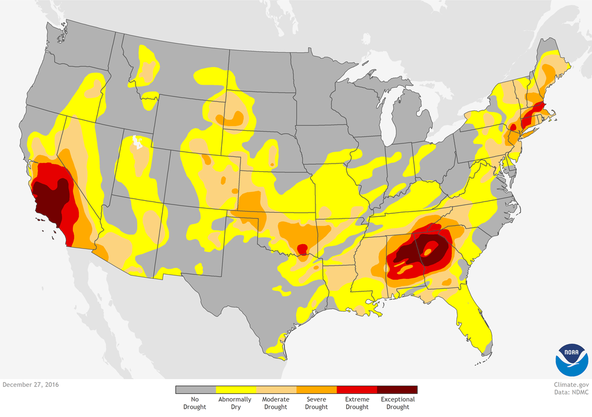
Drought monitor for the month of December 2016
- During 2016 California was clearly experiencing a drought, the cotton belt states of Georgia and Alabama also seemed to be experiencing a dry season.
- During 2016 California was clearly experiencing a drought, the cotton belt states of Georgia and Alabama also seemed to be experiencing a dry season.
|
|
|
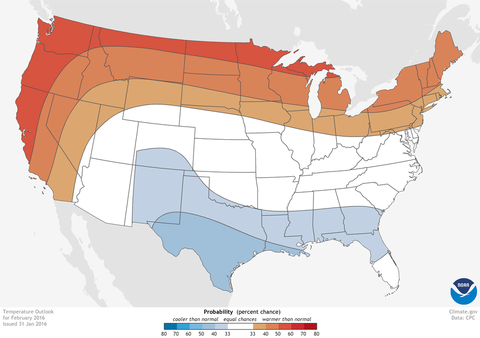
Temperature outlook for February 2016
-There seems to be a variation of cold and warm weather going through the U.S. |
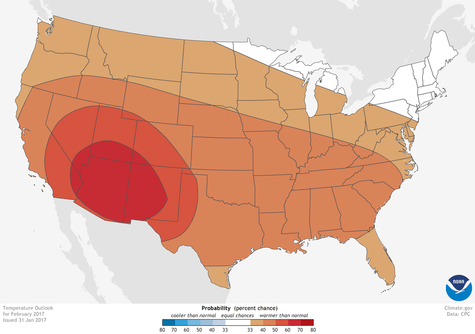
Temperature outlook for February 2017
-There seems to be warmer weather going through the US in 2017 compared to the data from 2016. |

|
|
|
Average temperature for August 2000
-The average temperature for August 2000 was quite warm across the US, especially in the southern parts of the nation. |
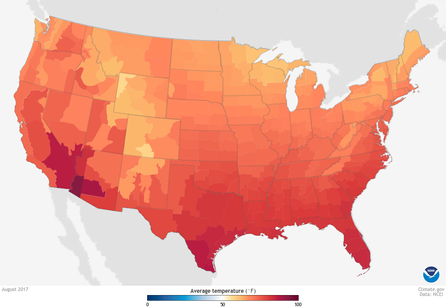
Average temperature for August 2017
-The average temperature for August 2017 was quite warm as well, however there seems to be slightly more heat in the north western corner of the country. |
|
|
|
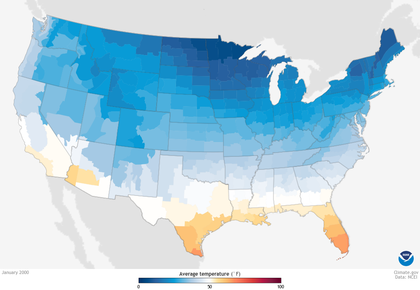
Average temperature for January 2000
-The temperature for January was obviously colder with a lower temperature especially in the northern part of the nation, and warmer temperatures in the southern part. |
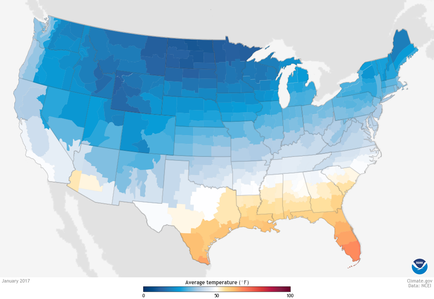
Average temperature for January 2017
-The temperature for January 2017 compared to January of 2016 seems to be slightly colder in the northern part of the country, yet warmer in the southeastern part of the country. |
Population Pyramids
The population of Turlock, CA is expanding slowly. This may be because of new commercial projects bringing more jobs and more people to Turlock.
The population of Williamsburg, VA is stable. However, the jump in population between the ages of 15 to 24 is unproportional due to the large amount of college students in the area.
The population of Hilmar, CA is stable. This stability may be caused by generations of families remaining in Hilmar, and few new families coming to the area, due to larger towns a few miles away.
The population of Chicago, IL is stable. There is a higher population concentration of people from ages 25 to 29 due to Chicago being home to many colleges.
The population of Waukon, IA is stable. Waukon is a small town that probably does not receive very many new residents, leaving a consistent amount of families who have lived there over many generations.
The population of Honolulu, HI is stable. Many people in Honolulu are most likely tourists, leaving a stable population living in the city.
The population of South Bend, IN is expanding slowly. This may be due to college students in the area deciding to stay in South Bend after receiving their education.
